Blogs
Data Visualisation 101
Data visualisation is a careful and thoughtful process of combining both data and visuals to convey the right message.
Data visualisation is a careful and thoughtful process of combining both data and visuals to convey the right message.

Coforge (Erstwhile WHISHWORKS) has been awarded UK Partner of the Year 2021 by MuleSoft, for its ability to deliver nationwide!

Exploring the challenges facing Telecommunications and the digital solutions set to transform the industry in 2021 and for the future.

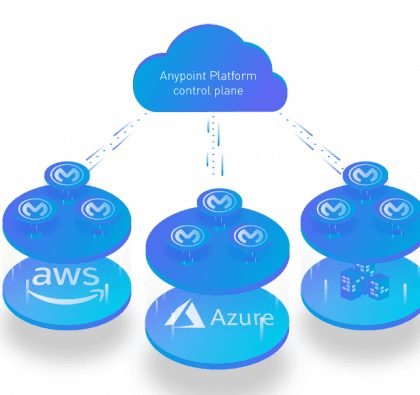
Coforge helped Frontier make MyFarm the go-to portal for all of Frontier’s digital services with MuleSoft’s Anypoint Platform.

With Mule 3.9 end of standard support around the corner, many users are getting really worried about their existing implementations and uncertain about the complexity and costs involved to migrate […]

This recipe aims to instruct users on using Mule DataWeave 2 with new capabilities in reusable functions, multi-part, URL-encoding and more.
In this article, we provide an overview of how to use the Ops Center to monitor Anypoint Runtime Fabric.

From lack of integration to shifting customer expectations, the industry faces many obstacles on its road to digital transformation.

If you want to improve your business processes and unlock new revenue streams, it is vital that you move to a more data-driven approach.

Undeniably, retail has been one of the industries that have been impacted the most from the coronavirus pandemic. Today, the retail landscape is faced with changing consumer behaviours favouring online […]

This whitepaper provides a comprehensive overview of the key digital transformations energy and utilities companies should focus on to stay ahead of competition.
From data-driven 2021 predictions to cloud-adoption, in this Data & Analytics round-up we are sharing some of the most recent industry posts.